Photovoltaic (PV) power plant equipment is typically selected almost exclusively on upfront cost, as capital expenditure, or CAPEX. But a more valuable analysis for PV plant design, build, and lifetime management would be to add accurate operational expense, or OPEX, to the initial financial decision-making process and project component selection.
Conducting a comprehensive lifetime cost assessment can provide asset owners with valuable insight into component selection and how this selection can affect PV plant lifetime revenue projections. Choosing components with an accurate estimate of total lifetime cost of ownership would allow stakeholders to improve profitability and minimize the operational risks of a project, particularly in the context of relatively short contractor warranty periods.
A Cost Comparison of PV Tracker Architecture: Centralized vs. Decentralized
ARRAY Technologies Inc., one of the leading suppliers of PV tracking technologies, retained RINA Consulting as an Independent Engineer to perform a lifetime cost comparative assessment of popular single-axis tracker architectures currently available in the solar PV market.
This assessment is structured in three phases:
Phase 1 – PV Tracker Lifetime Cost Methodology
Phase 2 – Model based on the Methodology
Phase 3 – Comparative Case Study utilizing the Model
In Phase 3 of this assessment, an analysis comparing ARRAY Technologies’ centralized tracking system with a market-standard, decentralized, single-axis tracker architecture was performed utilizing the PV tracker analysis model, PVTrax© which RINA developed from the methodology.
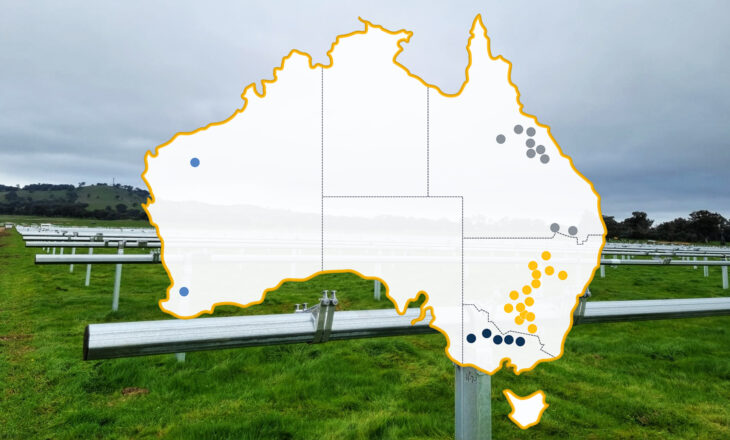
This comparative case study has been performed for a specific sample project location, a hypothetical 100 MWp PV plant somewhere in California, to ensure a fair comparison between the two trackers.
This assessment estimates the lifetime OPEX of the two distinct tracking architectures — centralized and decentralized — and compares the impact of tracker failures on the lifetime performance of the PV plant. In order to illustrate the lifetime OPEX, it is assumed that both tracking technologies have the same CAPEX.
The two-primary metrics for lifetime cost analysis are Levelized Cost of Energy (LCOE) and Net Present Value (NPV).
A Comparative Case Study on Two Approaches to Utility-Scale PV Solar Tracking
Approach 1: Multi-row tracking system (Tracker A, employing a centralized architecture)
Array’s Tracker A features articulated rotating drivelines with a disconnecting capability. This design introduces a great improvement with respect to traditional centralized architectures and makes it suitable for a variety of land topographies used in utility-scale PV plants as it does not require extensive grading prior to construction.
Approach 2: Single-row tracking system (Tracker B, employing a distributed architecture) Tracker B is a self-powered distributed system driving each row with a single drive motor, a controller, a battery, a battery charger, and a solar module. This system uses up to 32 times as many motors, controllers, and autonomous power supply systems than the centralized tracking system.
Comparing Operational Design, Reliability, and Maintenance
Comparing the operational and maintenance requirements for cleaning and mowing, Tracker A drivelines create small incremental operational costs due to the need to disconnect and then reconnect the drivelines.
This case study offers analysis showing that the robust design of the components in Tracker A are less likely to fail even though a motor failure could affect a larger number of rows. The case study goes on to show an additional 13,000 MWh are produced over the PV plant’s lifetime with ARRAY’s centralized architecture.
This case study details that Tracker B, utilizing a distributed architecture, requires a greater number of components that logically increases preventive maintenance, corrective maintenance, or both when compared with a centralized tracker architecture. The use of more components in a distributed architecture creates more potential points of failure and increases risk of plant downtime. Typically, and as in this case study, distributed architectures contain components such as batteries and sensors which have a significantly lower life expectancy which add up to much higher unplanned operational expenses.
Case Study Results and Conclusions
This case study highlights that while both tracking solutions initially are quite equal, it becomes evident that Tracker A, or the centralized architecture, is significantly more economically favorable after year 5.
Although Tracker A, the centralized architecture, features slightly higher specific fixed operational costs due to driveline tasks for mowing and cleaning, variable costs are significantly greater in Tracker B, the decentralized tracker architecture. The decentralized architecture incurs higher variable costs due to the contribution of components with a shorter lifetime (e.g. batteries) together with a far greater number of components.
Over the first five years, both tracker architectures have equivalent costs. But after the expiration of the typical 5-year tracker supplier warranty, Tracker B, the decentralized architecture, incurs higher costs from year 6 until the end of the lifetime of the plant.
This case study shows Tracker A’s centralized design creates appreciable savings and significantly improves asset profitability over the lifetime of the PV solar plant. Key drivers in the lower lifetime costs of the centralized tracker architecture are higher uptime and lower corrective maintenance.
Case Study Highlights
- NPV increases over 1.3 million dollars for asset owners using ARRAY trackers
- Lower LCOE over the plant’s lifetime with ARRAY’s centralized architecture
- Total lifetime OPEX is reduced by 42% by using the ARRAY tracker vs. the modeled distributed row architecture
- Higher energy output versus distributed tracker architecture
- More than 7% lower tracker lifetime costs with ARRAY trackers
Download our FREE case study to learn more!
For more detailed analysis, including access to tables and charts showing the inputs and results of each portion of the case study, please read the full report, methodology and view the PVTrax© tool
Click here for other articles by this author